Variation in the relationship between urban tree canopy and air temperature reduction under a range of daily weather conditions
Dexter Henry Locke, Matthew Baker, Michael Alonzo, Yichen Yang, Carly D. Ziter, Colleen Murphy-Dunning f, Jarlath P.M. O'Neil-Dunne
Highlights:
•Most urban heat research only considers surface temperature in the morning
•Air temperature is more salient for human health than surface temperature
•Bike-mounted temperature sensors measured landcover-air temperature relationships
•Trees cool most in mid-day, afternoon, and mornings, respectively
•Impervious surface warms most in evening on clear days, and during cloudy nights
Learn more!
1. Introduction
Trees are an important part of urban ecosystems in temperate, forested regions due to their capacity for providing ecosystem services. Trees help mitigate the lethality of the worsening urban heat island effect from climate change through shading and evapotranspiration. The effects of these different cooling mechanisms vary across space and over time and interact with other aspects of the built environment and regional meteorology. The well-described urban heat island (UHI) effect is the phenomenon where urbanized areas are hotter than their rural and suburban counterparts. This effect is due to the prevalence of impervious, dense surfaces that absorb, store, and re-radiate heat, combined with the lack of vegetative cover that cools through transpiration, and shades surfaces to prevent them from getting hot in the first place, Although spatial patterns of inter- and intra-urban surface temperature and inequity are well documented, less is known about spatio-temporal variability in air temperatures as they relate to urban land cover. The variable effects of tree canopy and impervious surface on air temperature throughout any relatively warm day, or across many days with varied cloud cover remains poorly understood.
Research on urban vegetation and urban heat frequently focuses on land surface temperature representing a single time of day. Due to its orbit, Landsat-based work in the contiguous United States measures surface temperature between 10 and 11 a.m. in the morning, before temperatures reach their daily maximum. Remotely sensed estimates of surface temperature are further hindered by clouds. Cloudy images are usually removed from analyses, challenging the ability to measure land cover-temperature relationships under cloudy conditions. Extrapolating land surface temperature via statistical and/or physical models introduces substantial uncertainty. Land surface temperatures did not correspond well to air temperatures recorded from fixed-location sensors in either Vancouver, Canada or Rotterdam, The Netherlands. Air temperature is a more salient measure for human health than surface temperature, even though it is more challenging to obtain. Yet spatially extensive, ground-level air temperature monitoring remains rare in urban areas.
Mobile urban air temperature monitoring via multiple methods overcomes these limitations by covering a larger geographic area than fixed-location sensor networks. Other mobile methods, such as on-foot measurements of air temperature capture greater heterogeneity than fixed-location sensor networks, and neither air temperature measurements corresponded well to land surface measures. Bike-based mobile monitoring has been shown to be an efficient, effective, and relatively inexpensive way to collect intra-urban temperatures across urban areas. Mobile measurements have improved the ability to measure and model urban air temperature at human-relevant spatial scales and throughout the day, capturing relevant inter- and intra-day variation for heat monitoring.
Mobile air-temperature monitoring efforts demonstrate how the built environment and urban form influence urban heat. Early car-based air temperature research identified the cooling effects of urban open spaces in Utrecht in the Netherlands. Bike-based research in Utrecht, The Netherlands found that the strongest predictors of the urban heat island were low sky view fraction (amount sky visible from the ground) and the high fractional building cover. Based on car-collected data, the more urbanized and denser local climate zone types were 0.5 °C–2.0 °C degrees warmer than less urbanized zones in the French city Nancy. Low density residential areas, with abundant vegetation were the coolest parts of Rotterdam, The Netherlands, based on a bike-collected data. Three mid-Atlantic US cities were cooler in highly vegetated areas and/or with lower building density, while roadways were the hottest, especially when vegetation near roadways was minimal, based on car-mounted sensors and modeling. Importantly the relationships between the built environment and heat varied throughout the day, making mobile observations critical for understanding diurnal urban heat trends.
Mobile sensors deployed at different times of day have captured inter- and intra-day variation relevant for heat monitoring. A pedestrian-based mobile monitoring system in Singapore showed that building shade can reduce temperature by as much as 4.5 °C, and vegetation can lower air temperatures up to 4 °C in the day time and 1.5 °C at night. Although urban parks can be the coolest in the middle of the day, they can be as warm as industrial areas due to bodies of water that store and re-emit heat at night. Patterns of shade change throughout the day as well as with different cloud conditions, thus relationship between vegetation and surface temperature also reflect similar temporal non-stationarity. How much and under what conditions landcover-air temperature relationships vary over time and across space remains poorly understood.
Some research has examined the non-stationarity among air temperature, tree canopy, and impervious surfaces over the course of a day using mobile monitoring. Bike-based research in Madison, Wisconsin revealed that tree canopy cover ranging from 0 to 100 % cover within a 90 m buffer around bike locations were non-linearly associated with ∼1.5 °C lower air temperature in the afternoon (∼16:00–18:00 local time). Impervious surfaces were linearly associated with 1.3 °C warmer air temperatures. Both cooling and warming effects were smaller in magnitude at night, again highlighting the importance of intra-day variation in landcover-heat relationships. Research in Washington, DC via car and using 200-m buffers showed that the difference in tree canopy cover from 5 % to 90 % was associated with 1.8 °C lower air temperature in the hottest part of the day (afternoon, 14:00–15:00 local time) and a slightly smaller 1.7 °C degree cooling effect in the evening (18:00–19:00). Concurrently, warming from impervious surfaces fell from 1.7 °C in the afternoon to 1.4 °C in the evening. Neither study accounted for cloud cover.
The lack of cloud measurement is especially important since trees reduce air temperatures via shading and evapotranspiration. Under cloudy conditions, the former effect is minimal and it is not well understood how much transpirational cooling persists under these conditions. Interestingly, it has been shown that cities even create clouds: they draw moisture in through advection and then a combination of turbulence from urban surface roughness and abundant urban aerosols create more clouds. Excluding clouds prevents us from understanding the role of trees’ cooling under cloudy conditions. Further, the changing daily landcover-air temperature relationships might be different on hotter days rather than cooler. Ziter and colleagues found more cooling from tree canopy cover on hotter days. To increase generalizability, more research in additional geographic locations is needed to better characterize and understand the relationships between landcover composition and air temperature across space and over time in conjunction with varied weather conditions.
This paper asks, 1) what are the relationships between air temperature and landcover, and how do they change throughout the day with varied cloud conditions? Because heat is a public health issue during especially hot periods, we also analyzed the land cover-air temperature relationships separately from the full dataset to understand whether the relationships changed. Next, we asked, 2) how do those landcover-air temperature relationships vary or not among the hottest 25th percentile days? We estimate how the relationships between landcover (tree canopy and impervious surface) and air temperature change throughout the day using bicycle-mounted air temperature sensors in New Haven, CT, from 2019 to 2021 and generalized additive mixed models (GAMM) across 156 rides. Land cover was summarized within 90-m buffers surrounding bike observations. The GAMMs used subsets of the data at different times of the day and controlled for cloud condition, wind speed and direction, elevation, and location, and ride. To evaluate the sensitivity to the time of day thresholds, the analyses were repeated with 1-h shifted subsets. The purpose of this paper is to understand how the relationship between land cover and air temperature change over time and across space, so that more realistic cooling benefits of urban trees can be obtained.
2. Methods
2.1. Study area
New Haven, Connecticut (population ∼130,000), is a city located in southern New England north of the Long Island sound, USA (41°18′29.0"N, 72°55′38.3"W, Fig. 1A). The municipality is ∼49.2 km2, and the region is classified as Dfa in the Köppen-Geiger climate classification system, or Humid Continental Hot Summers With Year Around Precipitation. The summers are warm and humid, the winters are cold and snowy, and it is partly cloudy all year. The mean annual temperature is 11.2 °C from 1981 to 2010, the mean annual January temperature is −1.11 °C, the mean annual July temperature is 23.33 °C, and the mean annual precipitation is 119.66 cm.
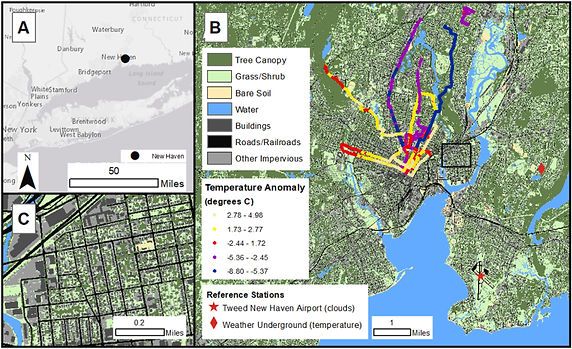
Fig. 1
New Haven in its regional context showing the Long Island Sound to the south (A), a sample of temperature-anomalous rides are overlaid on the high resolution (1 m2), high-accuracy (≥95 %) landcover data (B), a close up of the detailed landcover data (C).
2.2. Bike-based measures
We took mobile measurements of air temperature data using sensors mounted on bicycles' handle bars. The “Smart-T″ sensors communicate with cell phones to log GPS information for every temperature record (https://biking-for-science.yale.edu/sensors/smart-t). Sensors were contained within ABS-like resin radiation shields, and calibrated in a lab using two fans, which ensured that each sensor recorded ambient temperature accurately and consistently. Each bike ride generates a data transect along a biking route by logging latitude, longitude, time, and temperature. The spatial resolution of such data transect is 4 m when biking at a speed of 4 m/s (i.e., 14.4 km/h). The sensor's response time to step changes in temperature is 9.7 (±3.2) s.
We measured 156 transects. Rides occurred between June 15 and September 15 of each year between 2019 and 2021 to coincide with the warmest parts of the year. The biking routes start in highly impervious residential areas. Most routes were selected by volunteer cyclists (one coauthor, a university professor, and staff member) corresponding to their commuting routes. These volunteers took different routes to and from work and home to cover a larger area. This approach is both practical for data collection and may reflect common human experiences of urban heat but results in neither a fully random nor systematic sampling design (e.g. Fig. 1B). We therefore designed three additional routes to capture areas with high percent tree canopy cover, directing riders (incoming masters students) through one or more urban parks to ensure a range of land cover conditions were included. The routes were not the same each day, nor were the routes ridden at the same time, as a result the land cover summaries vary across hotter or cooler and/or cloudy days. The rides averaged 32 min, ranging from 1 to 86 (median 32, interquartile range = 19.11). Relatively short ride durations (i.e. ∼30 min) were intended to reduce the influence of changing background temperature throughout a ride.
Parts of the tree canopy in each bike-based point comes from street trees. The street tree population varies in size and species; common species include oaks, maples, Honey locust, Bradford pear, ornamental cherry and apple trees, and dogwood. The street inventory map can be found here: https://uri.yale.edu/maps/street-tree-inventory-map.
[Article continues. Reproduced for educational purposes.]